$Benchline · Used-Car Inventory & Margin Tool
$99 · one-time Get instant access
For used-car & inventory managers, GMs & independent dealers

The money aging on your lot — and a number you can actually recover.

Drop in your inventory snapshot and last month's sales. See your aging mix, days supply, turn, front gross and recon time against benchmarks — then a what-if that prices the holding cost bleeding out of aged units and the realistic 30–50% you can recover.

Benchmarks from the NADA Slide Guide & used-car industry standards
Works in Excel & Google Sheets · Instant download · One-time payment
Used inventory readout Example lot · 120 units
Inventory over 60 days20.0%▼ over target
Days supply46▼ over 45
Monthly holding cost, aged units$23,040▼ bleed
TURN / YR
7.9
AGED >60
24
RECON
5d
Gross within reach · realistic (35% capture)
$137,000 / yr
≈ $118k–$196k a year at a 30–50% capture rate
Theoretical ceiling, if every lever hits target at once: $392,000/yr — used-car gains depend on your market, so we lead with the low end of the band.
Your lot's numbers will differ. This is the example lot shipped in the workbook.
See inside

This is the actual tool.

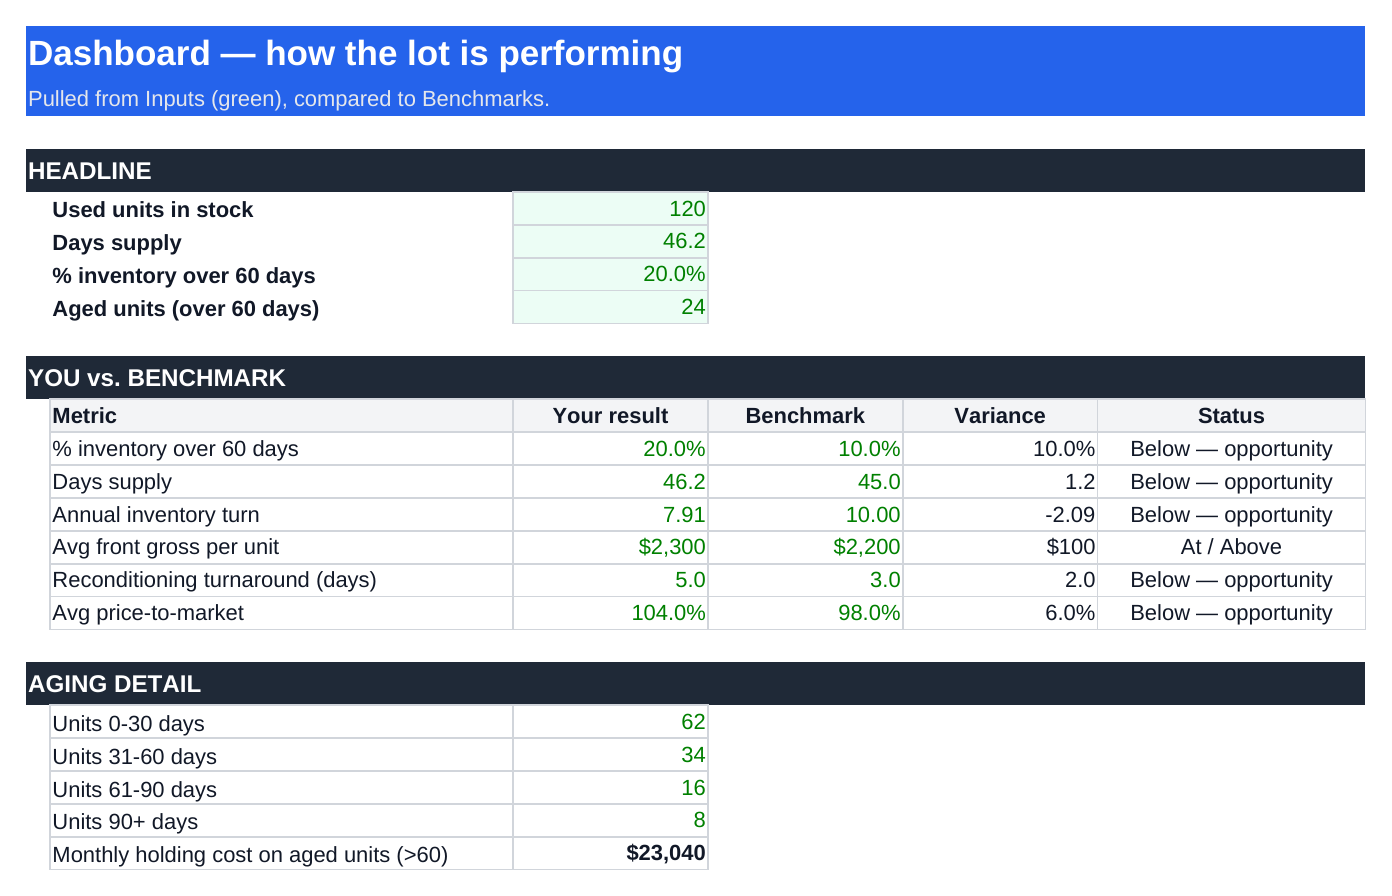
Used-Car Inventory & Margin Tool dashboard

The Dashboard tab, shown with sample numbers — your figures replace them in seconds. Runs in Excel or Google Sheets.

Why we don't quote the big number

Any spreadsheet can multiply your aging and turn gaps and flash a six-figure headline. You know better — turn and aging gains lean on market demand and pricing, not just internal process. So this tool shows the full gap as a ceiling, then applies a realistic capture rate — defaulting to 35%, the lower end of the band, because used-car recovery is market-dependent. The number you take to your next appraisal and pricing review is one you can defend.

What's inside

Three tabs. Ten minutes a week.

Enter your snapshot once. See where your aging, turn and gross really sit, price the holding-cost bleed honestly, and check every figure against dated, sourced benchmarks you can edit.

Tab 01 · Dashboard

Where the lot stands

Aging mix (0-30 / 31-60 / 61-90 / 90+), days supply, annual turn, front gross per unit, recon time and price-to-market — each flagged Below or At / Above, plus the monthly holding cost your aged units are burning.

Tab 02 · What-If

Price the bleed — honestly

Set targets for days supply, aged-unit count and front gross, and a capture rate. Read the holding cost saved and gross recovered monthly and annually — ceiling and realistic side by side.

Tab 03 · Benchmarks

Sourced, and yours to edit

No units over 60 days, recon ~3 days, days supply ~45, turn ~10–12 — each dated and cited (NADA, industry standards). Different market? Overwrite the targets and every comparison updates.

The workflow

From an inventory snapshot to a pricing plan

01

Enter the lot

Type your aging buckets, inventory cost, last month's sales and holding cost into the blue cells.

02

Read the Dashboard

See exactly where aging, turn and gross fall short — and what the aged units cost you monthly.

03

Run the What-If

Set targets and a realistic capture rate. Get a defensible dollar figure, not a ceiling.

04

Work the plan

Price aged units to market, tighten recon, and appraise to turn. Re-check weekly.

Where the numbers come from

Benchmarks used-car managers already run by

No units > 60 daysThe aging discipline that protects gross; 10% over 60 is a realistic working target. NADA Slide Guide.
Recon ~3 daysReconditioning turnaround target — every extra day is a day of holding cost and lost front-line time. NADA Slide Guide.
Days supply ~45Healthy days supply and ~10–12 annual turns keep capital moving. Industry standard; editable.
Hold ~$30–40/dayFloorplan interest, depreciation and overhead per unit per day — the meter running on every aged car. Industry estimate; editable.

Built for managers who live by turn. Used-car benchmarks vary widely by market, segment and floorplan terms — they're directional targets, not guarantees.

Who it's for

Anyone accountable for used inventory

Used-car managers Inventory managers GMs & dealer principals Independent dealers BHPH operators Single-point lots

Franchise or independent — enter your own lot and leave blank whatever doesn't apply.

Questions

Straight answers

Is this a subscription?+
No. One-time $99 — yours to keep, with free updates to this version.
Excel or Google Sheets?+
Both. Download the .xlsx or copy it into Google Sheets — all formulas work in either.
Do I need my inventory system connected?+
No. You type in your aging buckets and sales from your existing reports — no integration required.
Why does the capture rate default to 35%?+
Used-car gains depend on market demand and pricing, not just process — so we default to the lower end of the 30–50% band. It's fully editable to your market.
Does it work for an independent or BHPH lot?+
Yes. The math runs on your inputs — enter your units, aging and sales and leave anything that doesn't apply blank.
What if it's not for me?+
30-day money-back guarantee — no questions asked.

Stop paying to age cars. Start working a number you can defend.

Instant download · Excel & Google Sheets · One-time $99 · 30-day guarantee

Get the Used-Car Inventory & Margin Tool — $99