$Benchline · F&I Performance & Menu Optimizer
$129 · one-time Get instant access
For F&I managers, GMs & dealer principals

The back-end gross you're leaving on the table — and a number you can actually hit.

Drop in one month of F&I numbers. Get your PVR, products-per-deal and penetration against current benchmarks — plus a what-if that prices the gap and shows the realistic 30–50% you can capture. Not a fantasy ceiling.

Benchmarks from StoneEagle, NADA & the Haig Report
Works in Excel & Google Sheets · Instant download · One-time payment
Monthly F&I readout Example store · 100 units
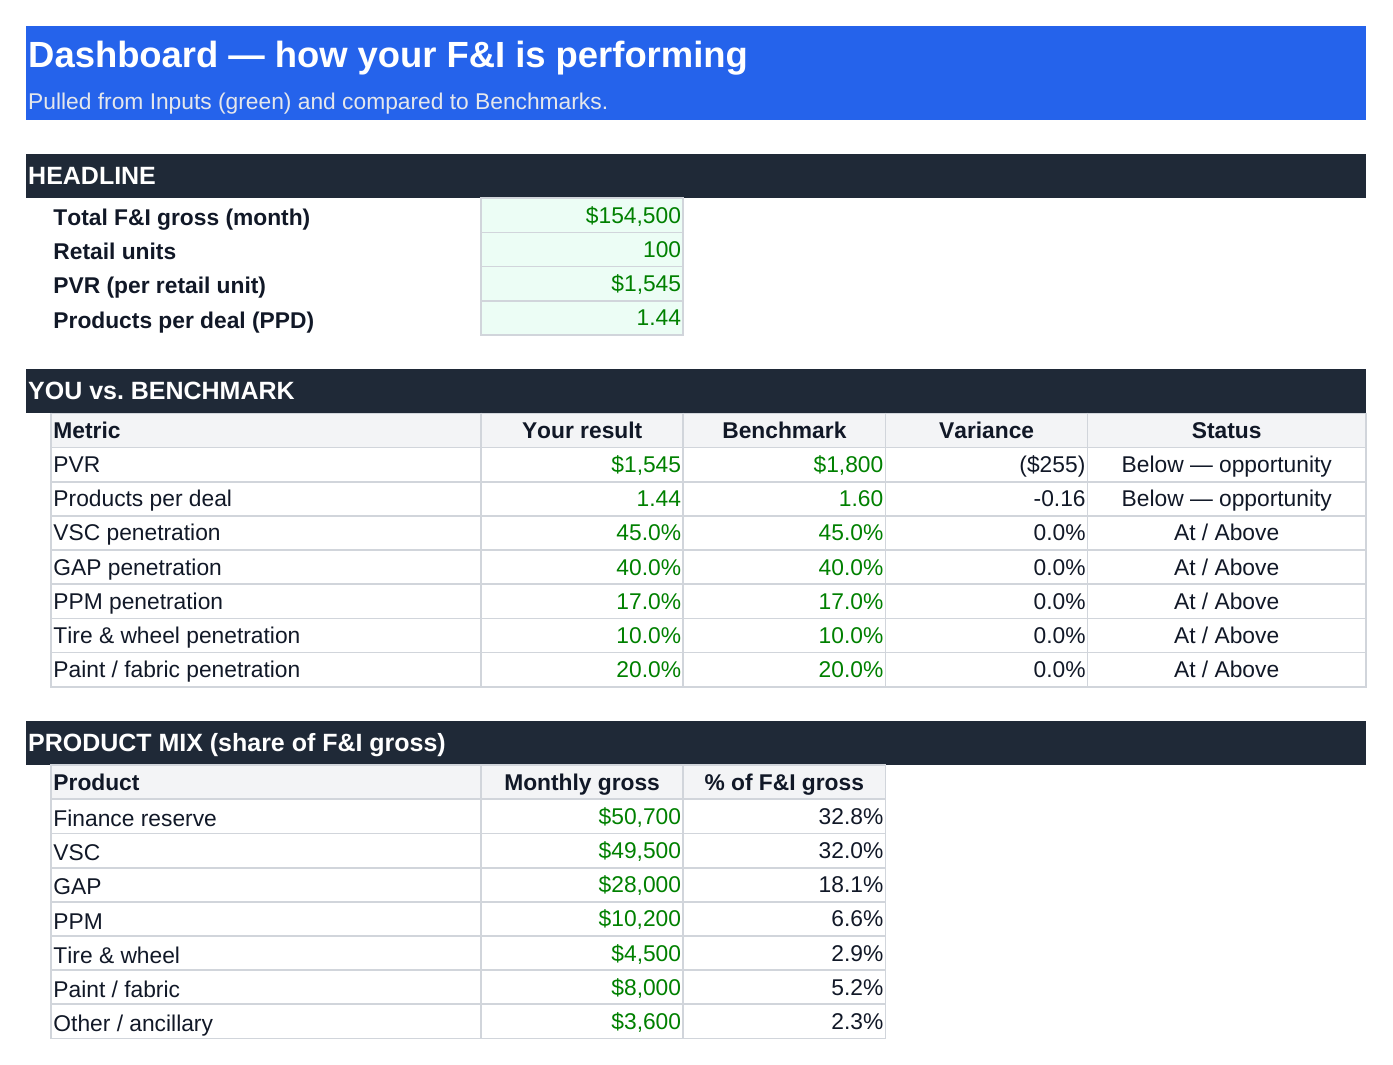
PVR (per retail unit)$1,545▼ Below
Products per deal1.44▼ Below
Benchmark PVR$1,800target
VSC
45%
GAP
40%
PPM
17%
Gross within reach · realistic (40% capture)
$144,960 / yr
≈ $109k–$181k a year at a 30–50% capture rate
Theoretical ceiling, if you hit 100% of every benchmark at once: $362,400/yr — nobody captures the whole gap, so we don't headline it.
Your store's numbers will differ. This is the example store shipped in the workbook.
Why we don't quote the big number

Any spreadsheet can multiply your penetration gaps and flash a six-figure headline. You know better — nobody moves every product to benchmark at once. So this tool shows the full gap as a ceiling, then applies a realistic capture rate (default 40%, editable) for what training and menu discipline actually recover over a quarter or two. The number you take to your next save is one you can defend in front of your GM.

What's inside

Three tabs. Ten minutes a month.

Enter your numbers once. Read where you stand, price the gap honestly, and check every figure against dated, sourced benchmarks you can edit.

Tab 01 · Dashboard

Where you stand

Your PVR, products-per-deal and penetration by product versus benchmark — each flagged Below or At / Above. Your whole month at a glance, plus product-mix share of F&I gross.

Tab 02 · What-If

Price the gap — honestly

Set a target penetration per product and a capture rate, and read the added gross monthly and annually. Ceiling and realistic number side by side, so you quote what you can back up.

Tab 03 · Benchmarks

Sourced, and yours to edit

VSC ~45%, GAP ~39–40%, PVR ~$1,800 — each dated and cited (StoneEagle, NADA, Haig). Better data for your brand or region? Overwrite it and every comparison updates.

The workflow

From your DMS totals to a coaching number

01

Enter last month

Type your unit and product totals into the blue cells. No integration, no IT — about ten minutes.

02

Read the Dashboard

See exactly where you're below benchmark on PVR, PPD and each product.

03

Run the What-If

Set targets and a realistic capture rate. Get a defensible dollar figure, not a ceiling.

04

Work the gap

Take it to your next T.O., menu review and one-on-ones. Re-run next month to track it.

Where the numbers come from

Benchmarks your best F&I people already trust

VSC ~45%Vehicle service contract penetration. StoneEagleDATA, Q4 2025 — F&I data aggregated from 6,000+ dealerships.
GAP ~39–40%GAP penetration (39% quarterly average, peaked 40% in November). StoneEagleDATA, Q4 2025.
PVR ~$1,800Typical-store F&I gross per vehicle; ~$1,995 at the Q4 2025 record. JMA Group / StoneEagle.
PVR $2,515F&I PVR at publicly-traded groups (Q2 2025) — shown as a stretch reference. Haig Report.

Built by people who know the difference between door rate and effective rate. Benchmarks are directional and vary by brand, region and deal mix — they're targets, not guarantees.

Who it's for

Anyone accountable for the back end

F&I managers GMs & dealer principals F&I trainers 20-Group members Single-point stores Used-car & independent lots

Franchise or independent — enter your own product mix and leave blank whatever doesn't apply.

Questions

Straight answers

Is this a subscription?+
No. It's a one-time $129 purchase — yours to keep, with free updates to this version.
Excel or Google Sheets?+
Both. Download the .xlsx for Excel, or copy it straight into Google Sheets. All formulas work in either.
Do I need my DMS connected?+
No. You type in your month's totals — no integration, no IT ticket, no vendor call.
Are the benchmarks current?+
Yes — sourced from StoneEagle, NADA and the Haig Report, dated on the Benchmarks tab, and editable so you can drop in better data for your brand or region.
Will it work for a used-only or independent lot?+
Yes. Enter your product mix and leave rows blank that don't apply. The math adjusts to your inputs.
What if it's not for me?+
30-day money-back guarantee — no questions asked.

Stop guessing at your back end. Start working a number you can defend.

Instant download · Excel & Google Sheets · One-time $129 · 30-day guarantee

Get the F&I Performance & Menu Optimizer — $129