$Benchline · Dealership P&L + KPI Dashboard
$199 · one-time Get instant access
For GMs, dealer principals & owners · the flagship

Your whole store on one page — and the money you can actually capture.

One month of store numbers becomes a clean monthly P&L, a 15-KPI scorecard flagged against benchmarks, and a consolidated what-if that prices your biggest gaps. The command view that sits on top of the department tools — no DMS integration, no consultant.

Benchmarks from NADA & StoneEagle, plus editable industry references
Works in Excel & Google Sheets · Instant download · One-time payment
Monthly store readout Example store
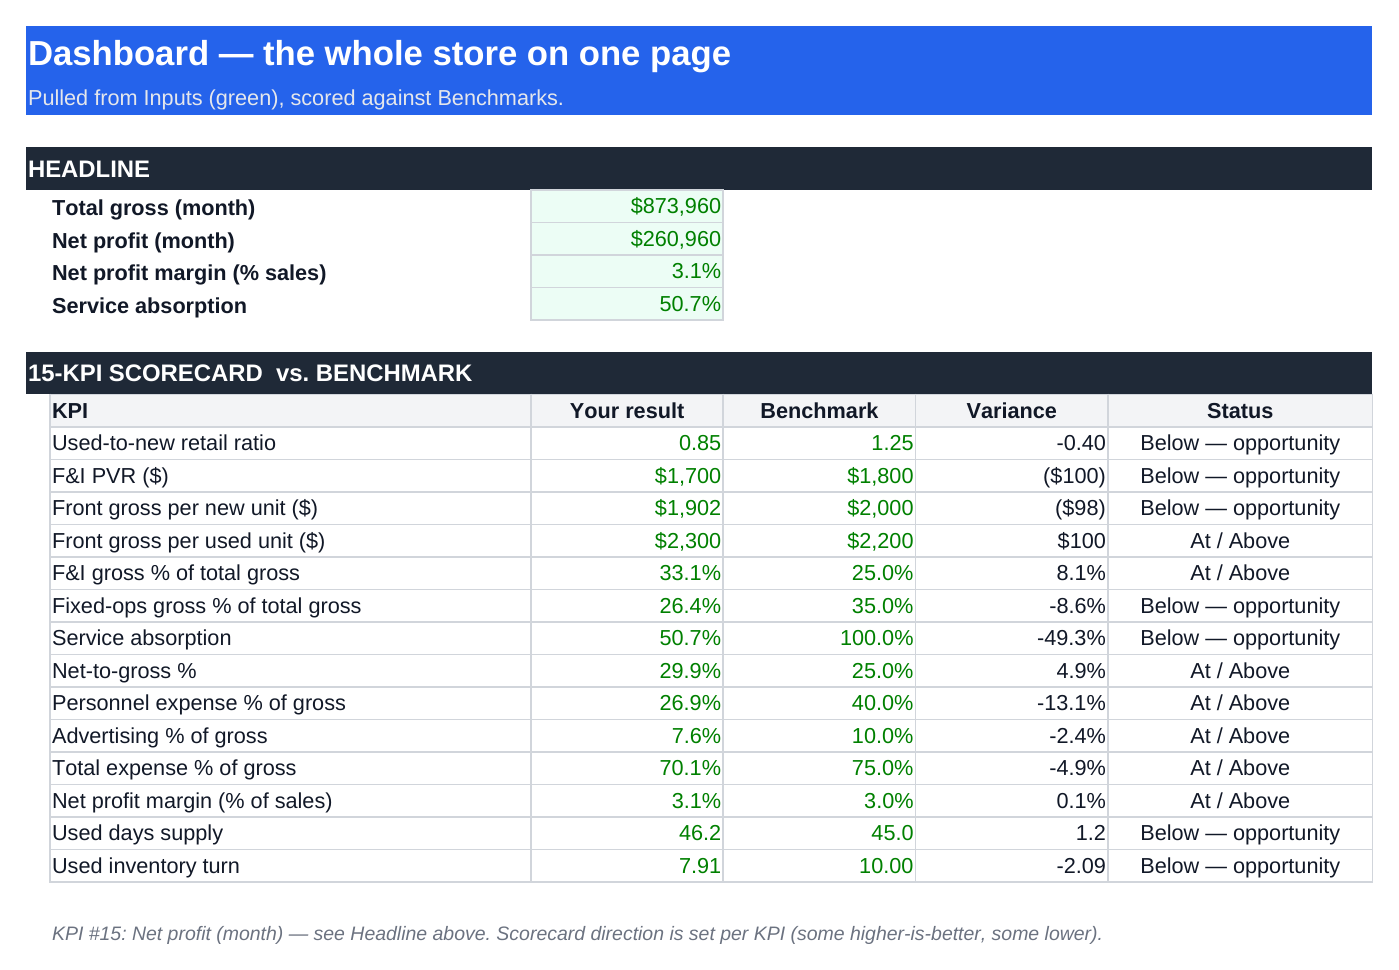
Total gross (month)$873,960
Net profit (month)$260,9603.1%
Net margin vs. 3.0% target3.1%At / Above
F&I PVR
$1,700
ABSORP
51%
USED TURN
7.9
Consolidated gross in reach · realistic (40% capture)
$226,000 / yr
≈ $170k–$283k a year at a 30–50% capture rate
Theoretical ceiling, if every lever hits target at once: $565,000/yr — across F&I, front-end and inventory. Nobody captures it all, so we don't headline it.
Your store's numbers will differ. This is the example store shipped in the workbook.
Why we don't quote the big number

Any dashboard can add up every department's gaps and flash a number north of half a million. You run the store — you know no month closes with F&I, front-end and inventory all at benchmark at once. So this rolls the full gap into a ceiling, then applies a realistic capture rate (default 40%, editable) blended across the departments. The number you take to your manager meeting is one you can stand behind.

What's inside

Six tabs. Your month, end to end.

Enter the store once. Read a real P&L, score fifteen KPIs against benchmarks, and see the consolidated money in reach — all from one workbook.

Tab · P&L

A real monthly statement

Gross by department — new, used, F&I, service, parts — then variable, personnel, advertising, semi-fixed and fixed expense, down to net profit, net margin and service absorption. The whole store in one column.

Tab · Scorecard

15 KPIs vs. benchmark

Used-to-new, F&I PVR, front gross per unit, gross mix, absorption, expense ratios, net margin, days supply and turn — each flagged Below or At / Above, sourced where it counts and editable everywhere.

Tab · What-If

The money, consolidated

The biggest store-level gaps priced in one place — F&I PVR, front-end gross, used velocity — with the realistic capture band front and center. The department tools break each one down further.

The workflow

From a month-end close to a manager-meeting agenda

01

Enter the store

Type your new, used, F&I, service, parts and expense totals into the blue cells.

02

Read the P&L

See gross by department and net profit — a clean statement, no accountant required.

03

Score the KPIs

Fifteen metrics flagged against benchmark. See exactly where the store is soft.

04

Work the gaps

Take the consolidated What-If — at a realistic capture — into your next manager meeting.

Where the numbers come from

Sourced where it matters, editable everywhere

Used-to-new 1.25The healthy used-to-new retail ratio. NADA Slide Guide.
F&I PVR $1,800Typical F&I gross per vehicle retailed. StoneEagleDATA.
Net margin ~2–4%Recent dealership pretax margins — a directional reference marked as typical, not a sourced figure. Industry; editable.
Sourced vs. typicalThe Benchmarks tab labels which figures are sourced and which are industry-typical, so you know what to trust and what to replace. Built in.

Honest by design: expense and margin references are marked "typical" and meant to be swapped for your own or your 20-group's numbers. Benchmarks are directional, not guarantees.

Who it's for

Anyone who owns the store's number

GMs Dealer principals & owners Controllers & office managers 20-Group members Multi-store operators Buy-side / dealer groups

Pairs with the F&I, Fixed-Ops and Used-Car tools — this is the roll-up; those are the department deep-dives.

Questions

Straight answers

Is this a subscription?+
No. One-time $199 — yours to keep, with free updates to this version.
Excel or Google Sheets?+
Both. Download the .xlsx or copy it into Google Sheets — all formulas work in either.
Do I need my DMS connected?+
No. You type in month-end totals from your financial statement — no integration, no IT, no consultant.
How is this different from the department tools?+
This is the store-level roll-up: a full P&L and a 15-KPI scorecard. The F&I, Fixed-Ops and Used-Car tools go deep on each department. They pair well — and come together in the bundle.
Are the benchmarks trustworthy?+
The Benchmarks tab labels every figure as sourced or industry-typical, and all of them are editable — so you steer by numbers you trust.
What if it's not for me?+
30-day money-back guarantee — no questions asked.

Run the whole store from one page. Start with a number you can defend.

Instant download · Excel & Google Sheets · One-time $199 · 30-day guarantee

Get the Dealership P&L + KPI Dashboard — $199