See inside
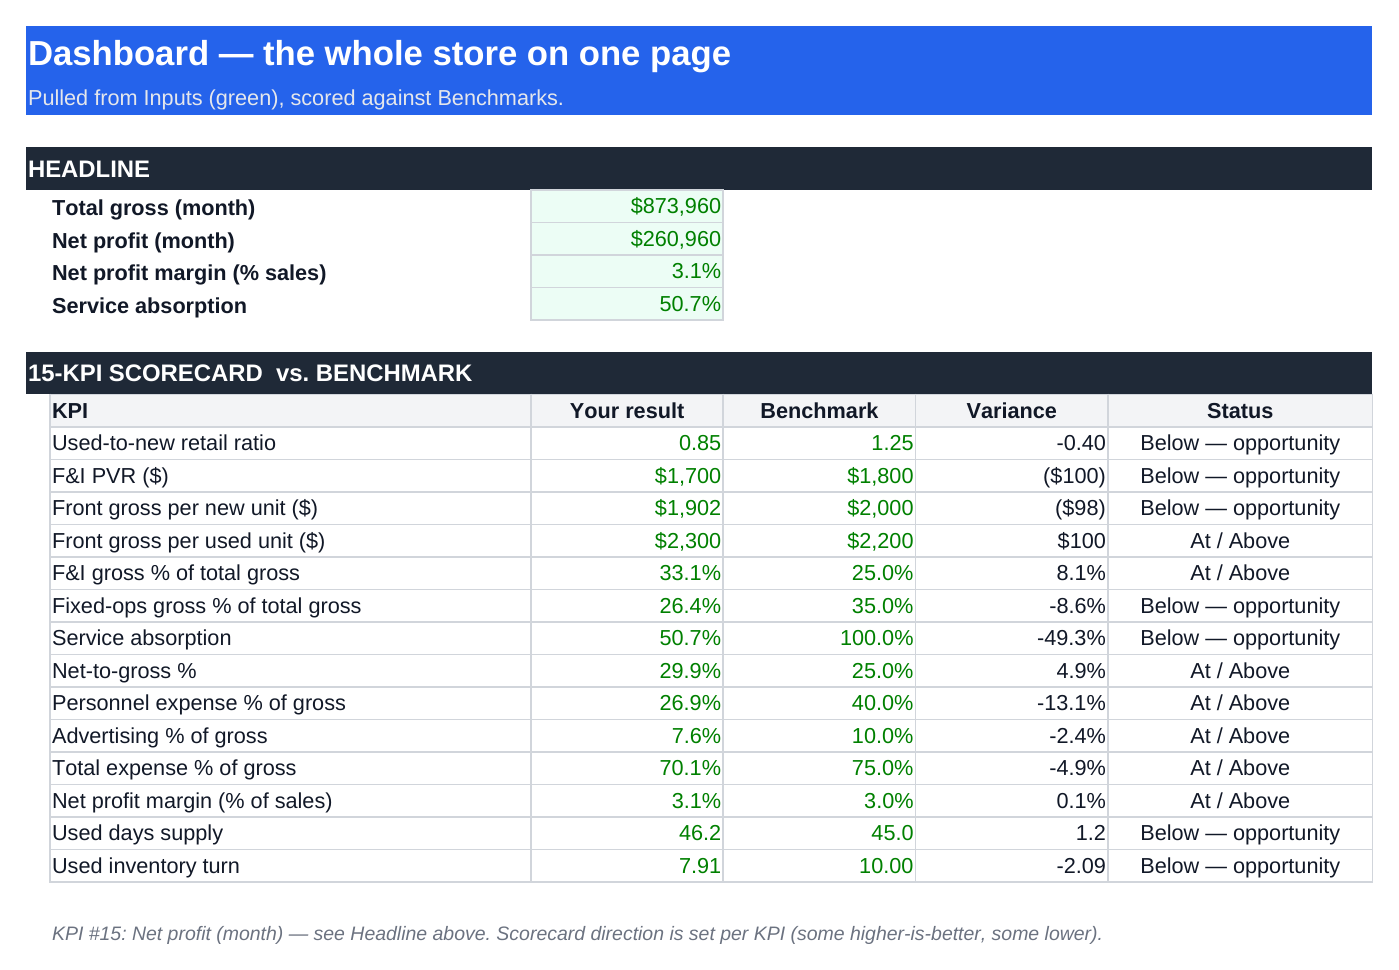
This is the actual tool.
Current sample workbook view. Read the buyer guide for definitions, setup and limitations.
A simplified dealer P&L, fourteen scored ratios and a separate profit headline. Enter mutually exclusive expenses, compare definitions and test independent operating scenarios.
Current sample workbook view. Read the buyer guide for definitions, setup and limitations.
Potential gross is a scenario, not money earned. Set targets you can justify, account for implementation costs, and compare actual results with your saved starting point. Annualized amounts use an unchanged monthly run-rate; no income or timeline is promised.
Enter the store once. Read a real P&L, score fifteen KPIs against benchmarks, and see the consolidated money in reach — all from one workbook.
Dashboard: fourteen scored ratios plus the operating-profit headline; zero-volume ratios are marked unavailable.
P&L: manually entered department gross less mutually exclusive operating expenses. Other income and tax are outside this simplified model.
What-If and references: independent scenarios, historical sources and clearly labeled editable targets. No automatic links between product files.
Type your new, used, F&I, service, parts and expense totals into the input cells.
See gross by department and net profit — a clean statement, no accountant required.
Fifteen metrics flagged against benchmark. See exactly where the store is soft.
Model an explicit target and assumed attainment. This is a planning scenario, not a forecast or guaranteed gain. Overlapping scenarios must not be added.
Other targets and example numbers are illustrative assumptions. No benchmark updates automatically.
Historical references and editable assumptions are labeled separately. Use comparable local data where available.
Use your own product mix and enter zero for required categories with no activity. Review every unavailable result.
XLSX workbook + buyer guide · One-time $199 · 30-day guarantee
Get the Dealership P&L + KPI Dashboard — $199