See inside
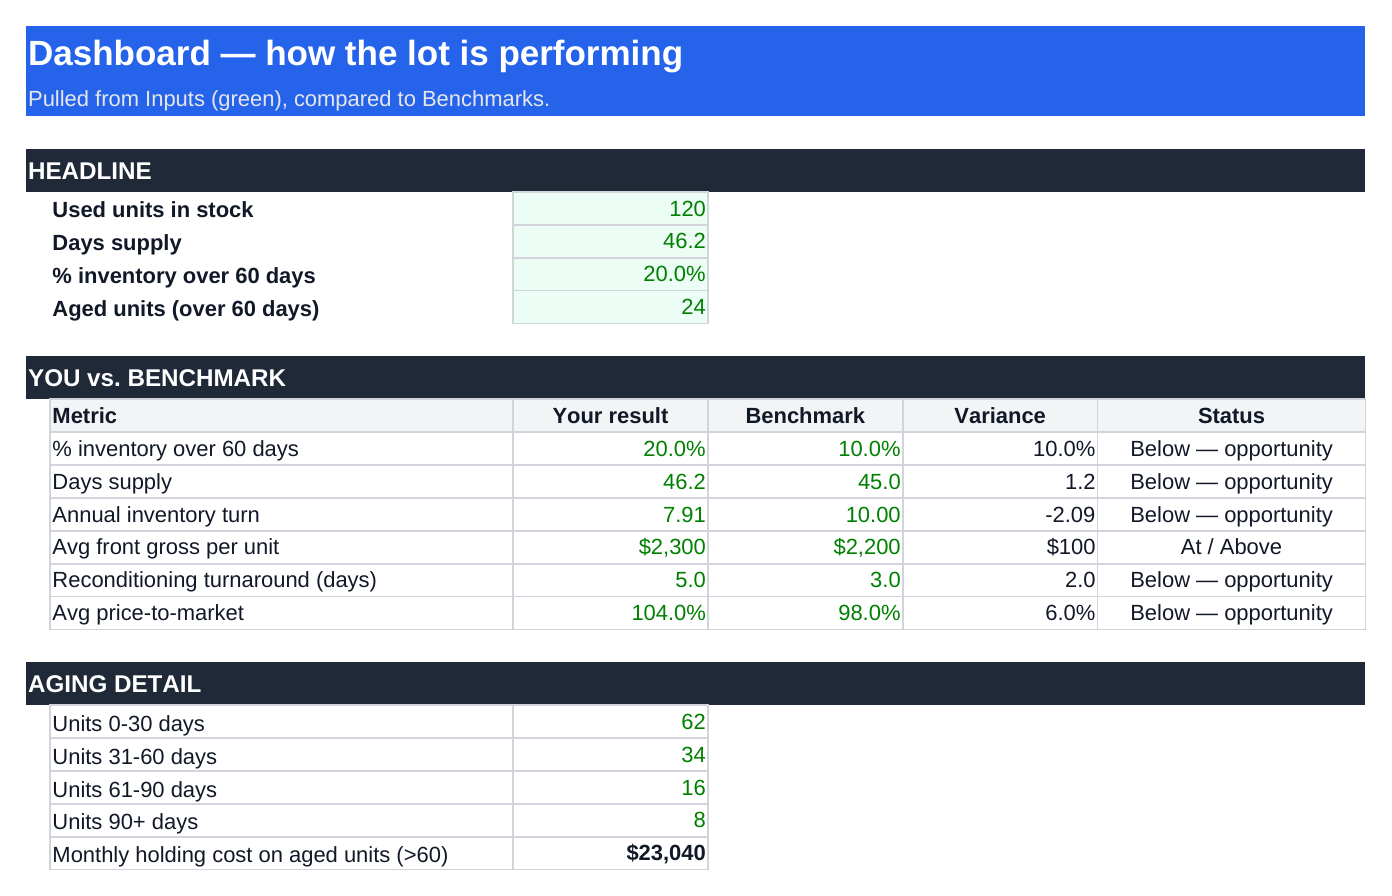
This is the actual tool.
Current sample workbook view. Read the buyer guide for definitions, setup and limitations.
Reconcile non-overlapping aging buckets, calculate days supply and turn consistently, and compare inventory scenarios using your own holding costs.
Current sample workbook view. Read the buyer guide for definitions, setup and limitations.
Potential gross is a scenario, not money earned. Set targets you can justify, account for implementation costs, and compare actual results with your saved starting point. Annualized amounts use an unchanged monthly run-rate; no income or timeline is promised.
Enter your snapshot once. See where your aging, turn and gross really sit, price the holding-cost bleed honestly, and check every figure against dated, sourced benchmarks you can edit.
Dashboard: reconciled aging, days supply, annualized turn and front gross per sold unit.
What-If: separate velocity, holding-cost and gross scenarios. The summary uses the largest lever; volume and demand assumptions remain visible.
Benchmarks: NADA context and editable planning targets. Holding cost is your estimate, not a universal market rate.
Type your aging buckets, inventory cost, last month's sales and holding cost into the input cells.
See exactly where aging, turn and gross fall short — and what the aged units cost you monthly.
Model an explicit target and assumed attainment. This is a planning scenario, not a forecast or guaranteed gain. Overlapping scenarios must not be added.
Price aged units to market, tighten recon, and appraise to turn. Re-check weekly.
Other targets and example numbers are illustrative assumptions. No benchmark updates automatically.
Historical references and editable assumptions are labeled separately. Use comparable local data where available.
Use your own product mix and enter zero for required categories with no activity. Review every unavailable result.
XLSX workbook + buyer guide · One-time $99 · 30-day guarantee
Get the Used-Car Inventory & Margin Tool — $99